
On Satuday I submitted the final grades for Math10A, the new UC Berkeley freshman math class for intended biology majors that I taught this semester. In assigning students their grades, I had a chance to reflect again on the system we use and its substantial shortcomings.
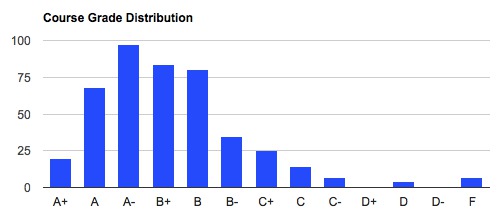
The system is broken, and my grade assignment procedure illustrates why. Math 10a had 223 students this semester, and they were graded according to the following policy: homework 10%, quizzes 10%, midterms 20% each (there were two midterms) and the final 40%. If midterm 1 was skipped then midterm 2 counted 40%. Similarly, if midterm 2 was skipped then the final counted 60%. This produced a raw score for each student and the final distribution is shown below (zeroes not shown):

The distribution seems fairly “reasonable”. One student didn’t do any work or show up and got a 5/100. At the other end of the spectrum some students aced the class. The average score was 74.48 and the standard deviation 15.06. An optimal raw score distribution should allow for detailed discrimination between students (e.g. if everyone gets the same score thats not helpful). I think my distribution could have been a bit better but I overall I am satisfied with it. The problem comes with the next step: after obtaining raw scores in a class, the professor has to set cutoffs for A+/A/A-/B+/B/B-/C+/C/C-/D+/D/D-/F. Depending on how the cutoffs are set, the grade distribution can change dramatically. In fact, it is easy to see that any discrete distribution on letter grades is achievable from any raw score distribution. One approach to letter grades would be to fix an A at, say, any raw score greater than or equal 90%, i.e., no curving. I found that threshold on wikipedia. But that is rarely how grades are set, partly because of large variability in the difficulty of exams. Almost every professor I know “curves” to some extent. At Berkeley one can examine grade distributions here.
It turns out that Roger Purves from statistics used to aim for a uniform distribution:

Roger Purves’ Stat 2 grade distribution over the past 6 years.
The increase in C- grades is explained by an artifact of the grading system at Berkeley. If a student fails the class they can take it again and record the passing grade for their GPA (although the F remains on the transcript). A grade of D is not only devastating for the GPA, but also permanent. It cannot be improved by retaking the class. Therefore many students try to fail when they are doing poorly in a class, and many professors simply avoid assigning Ds. In other words, Purves’ C- includes his Ds. Another issue is that an A+ vs. A does not affect GPA, but an A vs. A- does; the latter is obviously a very subjective difference that varies widely between classes and professors. Note that Roger Purves just didn’t assign A+ grades, presumably because they have no GPA significance (although they do arguably have a psychological impact).
Marina Ratner from math failed more students [Update November 9, 2014: Prof. Ratner has pointed out to me that she receives excellent reviews from students on Ratemyprofessors, while explaining that “the large number of F in my classes are due to the large number of students who drop the class but are still on the list or don’t do any work” and that “One of the reasons why my students learned and others did not was precisely because of my grading policy.”]. Her grade distribution for Math 1b in the Spring semester of 2009 is below:

Marina Ratner’s Math 1B, Spring 2009.
In the same semester, in a parallel section, her colleague Richard Borcherds gave the following grades:
Richard Borcherd’s Math 1B, Spring 2009.
Unlike Ratner, Borcherds appears to be averse to failing students. Only 7 students failed out of 441 who were enrolled in his two sections that semester. Fair?
And then there are those who believe in the exponential distribution, for example Heino Nitsche who teaches Chem 1A:

Heino Nitsche’s Chem 1A, Spring 2011.
The variability in grade assignment is astonishing. As can be seen above, curving is prevalent and arbitrary, and the idea that grades have an absolute meaning is not credible. It is statistically highly unlikely that Ratner’s students were always terrible at learning math (whereas Borcherds “luckily” got the good students). Is chemistry inherently easy, to the point where an average student taking the class deserves an A?
This messed up system is different, yet similar in other schools. Sadly, many schools have used letter grading to manipulate GPAs via continual grade inflation. Just three weeks ago on December 3rd, the dean of undergraduate education at Harvard confirmed that the median grade at Harvard is an A- and the most common grade an A. The reasons for grade inflation are manifold. But I can understand it on a personal level. It is tempting for a faculty member to assign As because those are likely to immediately translate to better course evaluations (both internal, and public on sites such as Ninja Courses and ratemyprofessor). Local grade inflation can quickly lead to global inflation as professors, and at a higher level their universities, are competing with each other for the happiest students.
How did I assign letter grades for Math 10A?
After grading the final exams together, my five GSIs started the process of setting letter grade thresholds by examining the grades of “yardstick students”. These were students for which the GSIs felt confident in declaring their absolute knowledge of the material to be at the A,B,C or F levels. We then proceeded to refine the thresholds adding +/- cutoffs by simultaneously trying to respect the yardsticks, while also keeping in mind the overall grade distribution. Finally, I asked the GSIs to consider moving students upward across thresholds if they had shown consistent improvement and commitment throughout the semester (a policy I had informed the students of in class). The result was that about 40% of the students ended with an A. Students failed the class at a threshold where we believed they had not learned enough of the material to proceed to math 10B. I have to say that as far as my job goes, assigning letter grades for courses is the least scientific endeavor I participate in.
What should be done?
Until recently grades were recorded on paper, making it difficult to perform anything but trivial computations on the raw scores or letter grades. But electronic recording of grades allows for more sophisticated analysis. This should be taken advantage of. Suppose that instead of a letter grade, each student’s raw scores were recorded, along with the distribution of class scores. A single letter would immediately be replaced by a meaningful number in context.
I do think it is unfair to grade students only relatively, especially with respect to cohorts that can range in quality. But it should be possible to compute a meaningful custom raw score distribution specific to individual students based on the classes they have taken. The raw data is a 3-way table whose dimensions consist of professors x classes x raw scores. This table is sparse, as professors typically only teach a handful of different courses throughout their career. But by properly averaging the needed distributions as gleaned from this table, it should be possible to produce for each student an overall GPA score, together with a variance of the (student specific) distribution it came from averaged over the courses the student took. The resulting distribution and score could be renormalized to produce a single meaningful number. That way, taking “difficult” classes with professors who grade harshly would not penalize the GPA. Similarly, aiming for easy As wouldn’t help the GPA. And manipulative grade inflation on the part of professors and institutions would be much more difficult.
Its time to level the playing field for students, eliminate the possibility for manipulative grade inflation, and to stop hypocrisy. We need to not only preach statistical and computational thinking to our students, we need to practice it in every aspect of their education.

14 comments
Comments feed for this article
December 23, 2013 at 1:23 pm
Geet
Good points and nice suggestion. I think it’s an extremely difficult problem to make grading ‘fair’, but your suggestion is certainly a step in the right direction. You could also imagine your scheme being applied ‘hierarchically’ in the sense that it could be applied to homework assignments within a class to come up with a renormalized ‘raw’ overall score for the class. This would help account for varying difficulty of homework assignments, for example.
December 23, 2013 at 3:17 pm
gasstationwithoutpumps
The approach you propose may work for large classes, but the small samples in small classes do not lend themselves well to statistical analysis or correction—you’d need to have strong priors.
Also, raw numbers are not used as the grading basis in all classes—writing classes, for example, include inherently subjective analysis of the quality of the student work.
December 23, 2013 at 4:01 pm
Lior Pachter
The point about the 3-way table I mentioned, is that even though a single class does not provide much data, aggregation/imputation over classes/professors can make it possible to make inferences even with small sample size in a specific professor/class combo. Just like the Netflix problem.
My post did focus on the sciences but I also looked at grade distributions in the humanities. The same chaos reigns there. Its true that many writing assignments are preferentially graded on a discrete scale, but aggregating those over a semester again produces a numerical raw score that can be just as meaningful as in a sciences class. I still think it makes no sense to convert those to single letter grades without context.
December 23, 2013 at 11:49 pm
astrin
I think the reason letter grades continue to plague us, as teachers, is that folks understand them. I’ve tried a lot of systems teaching big physics courses at Wisconsin, but in the end, the most effective thing has been to assign unscientifically determined letter grades on each exam. A student gets what “I got a B on that test and it’s 15% of my grade” means. The UW College of Letters and Science median grade is B, so I base my exam grading on B starting around 50 percentile. Things get funkier on the details (and we fortunately have A, AB, B, BC, C, D, F in our system) but there’s a bit of consistency to it. The final grade is essentially determined by the weighted GP mean, so as soon as the students see their finsl exam grade, they can calculate their final grade (which has a known homework and lab component). It takes the mystery out, and the TAs and I spend most of our time discussing the borderline students, which is aided by the fact that you can compare them head to head and ask “which one was better?”
I’m pretty happy with it. The students consider it to be a fair system. I also weight labs at 20%, homework at 15%, which helps out kids that have trouble on exams.
And that D/F policy at Cal is completely insane.
December 24, 2013 at 5:24 pm
gasstationwithoutpumps
The UC Berkeley policies about how grades are handled for repeated courses are specific to UCB. UCSC has more sensible policies: http://registrar.ucsc.edu/navigator/section4/minimum/repeating.html
(UCSC also has A+ through C, then D and F, there is no C-, nor + or – on D)
A D counts towards graduation credit, but not toward satisfying major requirements or prerequisites. D and F both allow repeating the course. Many faculty here also avoid the D, as being almost indistinguishable from an F.
August 27, 2014 at 4:28 pm
Roger Schank's deluded follower
Perhaps my deformed brain structure, brought on from teenage and later pot usage, leaves me incapable of understanding the grading system. If what is being taught matters, students should learn the best they can, without regard for grade competitions. Why do schools need to act as pre-employment services for employers? Let employers figure out who is the best for that coveted job opening. Imagine how much time would be saved if grades were abandoned. Simplify the system, just take parent’s income and give the best grades to the highest incomes. Oh wait, that’s already done with the admissions process.
September 9, 2014 at 5:37 pm
Cadmon
Valen Johnson, “An alternative to traditional GPA for evaluating student performance,” Statistical Science Volume 12, Number 4 (1997), 251-278. http://projecteuclid.org/euclid.ss/1030037959
suggests a way to compensate to some extent for differences in grading practices. By tracking citations to this article, one can find other suggestions.
September 10, 2014 at 3:58 pm
Jeff Dutky
“It is statistically highly unlikely that Ratner’s students were always terrible at learning math (whereas Borcherds “luckily” got the good students).”
But maybe one professor is actually a much better teacher than the other, which would lead to wide differences in their students learning and performance.
September 28, 2014 at 9:58 pm
Delta
“One approach to letter grades would be to fix an A at, say, any raw score greater than or equal 90%, i.e., no curving. I found that threshold on wikipedia. But that is rarely how grades are set, partly because of large variability in the difficulty of exams.”
I must admit that when these discussions arise, I am completely perplexed at why anyone does anything other than “no curving” policy (mentioned briefly here). Grades should indicate an objective mastery of the subject and not be measures of relative standing to other students. Success thresholds should be objective and known in advance to the incoming students. They should be transparent and not manipulated in secret after the last day of class. And it’s just generally simpler.
I’m kind of surprised that you had to turn to Wikipedia to find the normal base cutoffs for letter grades. 🙂 To my own students who ask in a statistics class, say, I will respond that “Grading to a curve is fundamentally misunderstanding statistics and/or fraud; curves are summary descriptions for data, not targets into which we mangle data”.
In my own case, I might have an outlier (hard) test or question the very first semester when I give it — in which case I scale that particular bungled question. But by the second semester I have that test “dialed in” so the average is reliably around 75 (plus or minus a few points) without me doing any mangling to it. I have a hard time interpreting why other instructors have any difficulty in this regard, except by dint of simply not trying or thinking about their tests except for the one night before presenting them.
September 28, 2014 at 10:05 pm
Lior Pachter
The reason I had to check wikipedia to find “normal” cutoffs is that I grew up in South Africa where the cutoffs (until 2008) were:
A: 80 – 100%
B: 70 – 79%
C: 60 – 69%
D: 50 – 59%
E: 40 – 49%
F: 35 – 39%
FF: 30 – 34%
August 20, 2015 at 1:31 am
Joe
My thought that as we move more and more towards quantification ad the ultimate measure, we find that there are so many arbitrary ways to grade and award points and weigh and replace scores that the whole process generates only noise –regardless of how nice an individual graph looks. I notice that fundamentally my learning and the myriad of politically motivated grading schemes, business and financially motivated institutions, grade inflation and quotas, weirder classes, really put the student second behind the process. I am older and have seen this devolve over decades. I think now, it is hard to watch something as idealistic as a grading scheme devolve into a random noise generating process–but I’m pretty convinced that’s what’s happening. I get an A in one math class a C in another a B+, one is ‘hard’ one not… Teachers without doctoral degrees, postdocs whose ‘job’ is to teach, and who don’t care—welcome to the last days of institutional learning.
February 4, 2016 at 3:33 pm
Trevor
This is an insightful post Lior. The model seems to suit one institution well – however what about comparing students from different institutions (or considering a student who attends different institutions)? It may be that Berkeley has a number of strong students and that an “average score” there would correspond to a higher score at a different institution (surely part of the motivation for standardized tests). Also, how would temporary lecturers or very sparse data would be accounted for (that may be present in a smaller institution)?
In Québec for instance, a collegial R score is calculated using a combination of class z-scores, “strength of the group” and other factors – http://en.wikipedia.org/wiki/R_score. The same is done at a university level aggregating majors together. Is it your sense that the variation of the grade distribution within mathematics would be lower than the variation between physics and mathematics for instance? How generalizable would this be between universities do you think? Thank you for any further insight.
February 9, 2016 at 10:29 am
Lior Pachter
Excellent point. Normalization between universities is more challenging than within, because there is less data with which to normalize. However I think that it might be possible given the movements of faculty between institutions, and sometimes students (via transfer).
June 14, 2021 at 6:45 pm
Dmitry Kondrashov
This is a very thoughtful post, but it still presupposes that the numeric scores earned predominantly through time-limited high-pressure exams are an appropriate measure of learning. As an instructional professor I have been thinking about this and implemented a less quantitative approach, replacing all exams with weekly assignments that can be revised and resubmitted without penalty (plus a final project) and grade them on a complete/incomplete scale. It’s hard to devise a controlled experiment, but my observation suggests that students at least don’t learn less (and possibly more) compared to when they had to take exams, and the grade distribution shifts upward significantly. Is that a problem? From the point of view of the institution, potentially, but if learning is the objective, no. Perhaps it’s time to abandon letter grades and points and focus on learning…