
The widespread establishment of statistics departments in the United States during the mid-20th century can be traced to a presentation by Harold Hotelling in the Berkeley Symposium on Mathematical Statistics and Probability in 1945. The symposium, organized by Berkeley statistician Jerzy Neyman, was the first of six such symposia that took place every five years, and became the most influential meetings in statistics of their time. Hotelling’s lecture on “The place of statistics in the university” inspired the creation of several statistics departments, and at UC Berkeley, Neyman’s establishment of the statistics department in the 1950s was a landmark moment for statistics in the 20th century.
Neyman was hired in the mathematics department at UC Berkeley by a visionary chair, Griffith Evans, who transformed the UC Berkeley math department into a world-class institution after his hiring in 1934. Evans’ vision for the Berkeley math department included statistics, and Eric Lehmann‘s history of the UC Berkeley statistics department details how Evans’ commitment to diverse areas in the department led him to hire Neyman without even meeting him. However, Evans’ progressive vision for mathematics was not shared by all of his colleagues, and the conservative, parochial attitudes of the math department contributed to Neyman’s breakaway and eventual founding of the statistics department. This dynamic was later repeated at universities across the United States, resulting in a large gulf between mathematicians and statistics (ironically history may be repeating itself with some now suggesting that the emergence of “data science” is a result of conservatism among statisticians leading them to cling to theory rather than to care about data).
The divide between mathematicians and statistics is unfortunate for a number of reasons, one of them being that statistical literacy is important even for the purest of the pure mathematicians. A recent debate on the appropriateness of diversity statements for job applicants in mathematics highlights the need: analysis of data, specifically data on who is in the maths community, and their opinions on the issue, turns out to be central to understanding the matter at hand. Case in point is a recent preprint by two mathematicians:
Joshua Paik and Igor Rivin, Data Analysis of the Responses to Professor Abigail Thompson’s Statement on Mandatory Diversity Statements, arXiv, 2020.
This statistics preprint examines attempts to identify the defining attributes of mathematicians who signed recent letters related to diversity statement requirements in mathematics job searches. I was recently asked to provide feedback on the manuscript, ergo this blog post.
Reproducibility
In order to assess the results of any preprint or paper, it is essential, as a first step, to be able to reproduce the analysis and results. In the case of a preprint such as this one, this means having access to the code and data used to produce the figures and to perform the calculations. I applaud the authors for being fully transparent and making available all of their code and data in a Github repository in a form that made it easy to reproduce all of their results; indeed I was able to do so without any problems. 👏
The dataset
The preprint analyzes data on signatories of three letters submitted in response to an opinion piece on diversity statement requirements for job applicants published by Abigail Thompson, chair of the mathematics department at UC Davis. Thompson’s letter compared diversity statement requirements of job applicants to loyalty oaths required during McCarthyism. The response letters range from strong affirmation of Thompson’s opinions, to strong refutation of them. Signatories of “Letter A”, titled “The math community values a commitment to diversity“, “strongly disagreed with the sentiments and arguments of Dr. Thompson’s editorial” and are critical of the AMS for publishing her editorial.” Signatories of “Letter B”, titled “Letter to the editor“, worry about “direct attempt[s] to destroy Thompson’s career and attempt[s] to intimidate the AMS”. Signatories of “Letter C”, titled “Letter to the Notices of the AMS“, write that they “applaud Abigail Thompson for her courageous leadership [in publishing her editorial]” and “agree wholeheartedly with her sentiments.”
The dataset analyzed by Paik and Rivin combines information scraped from Google Scholar and MathSciNet with data associated to the signatories that was collated by Chad Topaz. The dataset is available in .csv format here.
The Paik and Rivin result
The main result of Paik and Rivin is summarized in the first paragraph of their Conclusion and Discussion section:
“We see the following patterns amongst the “established” mathematicians who signed the three letters: the citations numbers distribution of the signers of Letter A is similar to that of a mid-level mathematics department (such as, say, Temple University), the citations metrics of Letter B are closer to that of a top 20 department such as Rutgers University, while the citations metrics of the signers of Letter C are another tier higher, and are more akin to the distribution of metrics for a truly top department.”
A figure from their preprint summarizing the data supposedly supporting their result, is reproduced below (with the dotted blue line shifted slightly to the right after the bug fix):

Paik and Rivin go a step further, using citation counts and h-indices as proxies for “merit in the judgement of the community.” That is to say, Paik and Rivin claim that mathematicians who signed letter A, i.e. those who strongly disagreed with Thompson’s equivalence between diversity statements and McCarthy’s loyalty oaths, have less “merit in the judgement of the community” than mathematicians who signed letter C, i.e. those who agreed wholeheartedly with her sentiments.
The differential is indeed very large. Paik and Rivin find that the mean number of citations for signers of Letter A is 2397.75, the mean number of citations for signers of Letter B is 4434.89, and the mean number of citations for signers of Letter C is 6226.816. To control for an association between seniority and number of citations, the computed averages are based only on citation counts of full professors. [Note: a bug in the Paik-Rivin code results in an error in their reporting for the mean for group B. They report 4136.432 whereas the number is actually 4434.89.]
This data seems to support Paik and Rivin’s thesis that mathematicians who support the use of diversty statements in hiring and who strongly disagree with Thompson’s analogy of such statements to McCarthy’s loyalty oaths, are second rate mathematicians, whereas those who agree wholeheartedly with Thompson are on par with professors at “truly top departments”.
But do the data really support this conclusion?
A fool’s errand
Before delving into the details of the data Paik and Rivin analyzed, it is worthwhile to pause and consider the validity of using citations counts and h-indices as proxies for “merit in the judgement of the community”. The authors themselves note that “citations and h-indices do not impose a total order on the quality of a mathematician” and emphasize that “it is quite obvious that, unlike in competitive swimming, imposing such an order is a fool’s errand.” Yet they proceed to discount their own advice, and wholeheartedly embark on the fool’s errand they warn against. 🤔
I examined the mathematicians in their dataset and first, as a sanity check, confirmed that I am one of them (I signed one of the letters). I then looked at the associated citation counts and noticed that out of 1435 mathematicians who signed the letters, I had the second highest number of citations according to Google Scholar (67,694), second only to Terence Tao (71,530). We are in the 99.9th percentile. 👏 Moreover, I have 27 times more citations than Igor Rivin. According to Paik and Rivin this implies that I have 27 times more merit in the judgement of our peers. I should say at least 27 times, because one might imagine that the judgement of the community is non-linear in the number of citations. Even if one discounts such quantitative comparisons (Paik and Rivin do note that Stephen Smale has fewer citations than Terence Tao, and that it would be difficult on that basis alone to conclude that Tao is the better mathematician), the preprint makes use of citation counts to assess “merit in the judgement of the community”, and thus according to Paik and Rivin my opinions have substantial merit. In fact, according to them, my opinion on diversity statements must be an extremely meritorious one. I imagine they would posit that my opinion on the debate that is raging in the math community regarding diversity statement requirements from job applicants is the correct, and definitive one. Now I can already foresee protestations that, for example, my article on “Transcript assembly and quantification by RNA-Seq reveals unannotated transcripts and isoform switching during cell differentiation” which has 9,438 citations is not math per se, and that it shouldn’t count. I’ll note that my biology colleagues, after reading the supplement, think it’s a math paper, but in any case, if we are going to head down that route shouldn’t Paik and Rivin read the paper to be sure? And shouldn’t they read every paper of mine, and every paper of every signatory to determine it is valid for their analysis? And shouldn’t they adjust the citation counts of every signatory? Well they didn’t do any of that, and besides, they included me in their analysis so… I proceed…
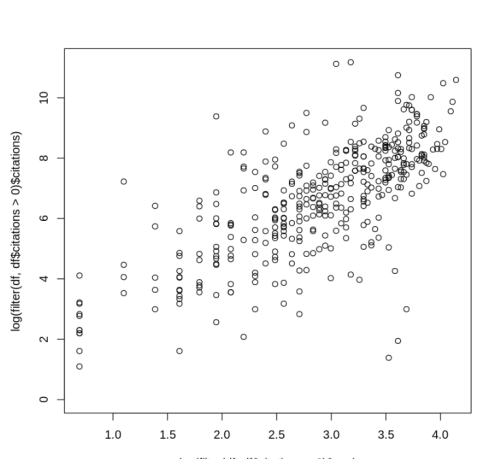
The citation numbers above are based on Google Scholar citations. Paik and Rivin also analyze MathSciNet citations and state that they prefer them because “only published mathematics are in MathSciNet, and is hence a higher quality data source when comparing mathematicians.” I checked the relationship between Scholar and MathSciNet citations and found that, not surprisingly, they have a correlation of 0.92:

I’d say they are therefore interchangeable in terms of the authors’ use of them as a proxy for “merit”.
But citations are not proxies for merit. The entire premise of the preprint is ridiculous. Furthermore, even if it was true that citations were a meaningful attribute of the signatories to analyze, there are many other serious problems with the preprint.
The elephant not in the room
Paik and Rivin begin their preprint with a cursory examination of the data and immediately identify a potential problem… missing data. How much data is missing? 64.11% of individuals do not have associated Google Scholar citation data, and 78.82% don’t have MathSciNet citation data. Paik and Rivin brush this issue aside remarking that “while this is not optimal, a quick sample size calculation shows that one needs 303 samples or 21% of the data to produce statistics at a 95% confidence level and a 5% confidence interval.” They are apparently unaware of the need for uniform population sampling, and don’t appear to even think for a second of the possible ascertainment biases in their data. I thought for a second.
For instance, I wondered whether there might be a discrepancy between the number of citations of women with Google Scholar pages vs. women without such pages. This is because I’ve noticed anecdotally that several senior women mathematicians I know don’t have Google Scholar pages, and since senior scientists presumably have more citations this could create a problematic ascertainment bias. I checked and there is, as expected, some correlation between age post-Ph.D. and citation count (cor = 0.36):
To test whether there is an association between presence of a Google Scholar page and citation number I examined the average number of MathSciNet citations of women with and without Google Scholar pages. Indeed, the average number of citations of women without Google Scholar pages is much lower than those with a Google Scholar page (898 vs. 621). For men the difference is much smaller (1816 vs. 1801). By the way, the difference in citation number between men and women is itself large, and can be explained by a number of differences starting with the fact that the women represented in the database have much lower age post-Ph.D. than the men (17.6 vs. 26.3), and therefore fewer citations (see correlation between age and citations above).
The analysis above suggests that perhaps one should use MathSciNet citation counts instead of Google Scholar. However the extent of missing data for that attribute is highly problematic (78.82% missing values). For one thing, my own MathSciNet citation counts are missing, so there were probably bugs in the scraping. The numbers are also tiny. There are only 46 women with MathSciNet data among all three letter signatories out of 452 women signatories. I believe the data is unreliable. In fact, even my ascertainment bias analysis above is problematic due to the small number of individuals involved. It would be completely appropriate at this point to accept that the data is not of sufficient quality for even rudimentary analysis. Yet the authors continued.
A big word
Confounder is a big word for a variable that influences both the dependent and independent variable in an analysis, thus causing a spurious association. The word does not appear in Paik and Rivin’s manuscript, which is unfortunate because it is in fact a confounder that explains their main “result”. This confounder is age. I’ve already shown the strong relationship between age post-Ph.D. and citation count in a figure above. Paik and Rivin examine the age distribution of the different letter signatories and find distinct differences. The figure below is reproduced from their preprint:

The differences are stark: the mean time since PhD completion of signers of Letter A is 14.64 years, the mean time since PhD completion of signers of Letter B is 27.76 years and the the mean time since PhD completion of signers of Letter C is 35.48 years. Presumably to control for this association, Paik and Rivin restricted the citation count computations to full professors. As it turns out, this restriction alone does not control for age.
The figure below shows the number of citations of letter C signatories who are full professors as a function of their age:

The red line at 36 years post-Ph.D. divides two distinct regimes. The large jump at that time (corresponding to chronological age ~60) is not surprising: senior professors in mathematics are more famous and have more influence than their junior peers, and their work has had more time to be understood and appreciated. In mathematics results can take many years before they are understood and integrated into mainstream mathematics. These are just hypotheses, but the exact reason for this effect is not important for the Paik-Rivin analysis. What matters is that there are almost no full professors among Letter A signers who are more than 36 years post-Ph.D. In fact, the number of such individuals (filtered for those who have published at least 1 article), is 2. Two individuals. That’s it.
Restricting the analysis to full professors less than 36 years post-Ph.D. tells a completely different story to the one Paik and Rivin peddle. The average number of citations of full professors who signed letter A (2922.72) is higher than the average number of citations of full professors who signed letter C (2348.85). Signers of letter B have 3148.83 citations on average. The figure for this analysis is shown below:

The main conclusion of Paik and Rivin, that signers of letters A have less merit than signers of letter B, who in turn have less merit than signers of letter C can be seen to be complete rubbish. What the data reveal is simply that the signers of letter A are younger than the signers of the other two letters.
Note: I have performed my analysis in a Google Colab notebook accessible via the link. It allows for full reproducibility of the figures and numbers in this post, and facilitates easy exploration of the data. Of course there’s nothing to explore. Use of citations as a proxy for merit is a fool’s errand.
Miscellania
There are numerous other technical problems with the preprint. The authors claim to have performed “a control” (they didn’t). Several p-values are computed and reported without any multiple testing correction. Parametric approximations for the citation data are examined, but then ignored. Moreover, appropriate zero-inflated count distributions for such data are never considered (see e.g. Yong-Gil et al. 2007). The results presented are all univariate (e.g. histograms of one data type)- there is not a single scatterplot in the preprint! This suggests that the authors are unaware of the field of multivariate statistics. Considering all of this, I encourage the authors to enroll in an introductory statistics class.
The Russians
In a strange final paragraph of the Conclusion and Discussion section of their preprint, Paik and Rivin speculate on why mathematicians from communist countries are not represented among the signers of letter A. They present hypotheses without any data to back up their claims.
The insistence that some mathematicians, e.g. Mikhail Gromov who signed letters B and C and is a full member at IHES and professor at NYU, are not part of the “power elite” of mathematics is just ridiculous. Furthermore, characterizing someone like Gromov, who arrived in the US from Russia to an arranged job at SUNY Stonybrook (thanks to Tony Phillips) as being a member of a group who “arrived at the US with nothing but the shirts on their backs” is bizarre.
Diversity matters
I find the current debate in the mathematics community surrounding Prof. Thompson’s letter very frustrating. The comparison of diversity statements to McCarthy’s loyalty oaths is ridiculous. Instead of debating such nonsense, mathematicians need to think long and hard about how to change the culture in their departments, a culture that has led to appallingly few under-represented minorities and women in the field. Under-represented minorities and women routinely face discrimination and worse. This is completely unacceptable.
The preprint by Paik and Rivin is a cynical attempt to use the Thompson kerfuffle to advertise the tired trope of the second-rate mathematician being the one to advocate for greater diversity in mathematics. It’s a sad refrain that has a long history in mathematics. But perhaps it’s not surprising. The colleagues of Jerzy Neyman in his mathematics department could not even stomach a statistician, let alone a woman, let alone a person from an under-represented minority group. However I’m optimistic reading the list of signatories of letter A. Many of my mathematical heroes are among them. The future is theirs, and they are right.

83 comments
Comments feed for this article
January 17, 2020 at 11:13 pm
Sandra
I am a member of an underrepresented group and a female scientist. I know that this blog post is meant to be supportive of both. However, I want to beg you, please, stop referring to members of underrepresented groups as “URMs”. It is not kind or respectful or supportive. Please ask yourself this question: For what other group of people, is it socially and professionally acceptable to refer to that group of people as an acronym? It is an uncomfortable question as it should be. Diversity is inevitable. Adopting inclusive practices is a choice and this can begin with the use of inclusive language. It is not enough to accept members of underrepresented groups into academic environments and then for the environments to be hostile. We desperately need that to be considered as well and inclusive language is part of that.
January 18, 2020 at 7:31 am
Lior Pachter
Thanks for your comment. You are correct and your point is well taken. I have edited the post to remove the acronym. I apologize for not thinking this through.
January 18, 2020 at 10:02 am
gasstationwithoutpumps
The “woke” student paper here uses POC for “person of color”—it took a while to figure out acronym, which is a good reason to avoid acronyms like URM and POC—especially for phrases that people don’t use to describe themselves commonly.
January 17, 2020 at 11:43 pm
STEM Caveman
Statistics needs an antonym to “confound” (confounder, confounding), to describe cases of overcomplicating an analysis that is likely to be substantially correct, or to have an important and useful finding with a largely correct (if not perfect and complete) interpretation, in order to dismiss that valid and useful analysis as being bogus and incompetent. I propose “perplex” (perplexer, perplexing) for the act of introducing such cavils while ignoring, dismissing, or seeking to obscure the obvious merits of the analysis.
Other than some problems with outliers, that can be corrected by various standard means, if the Paik & Rivin interpretation is more or less correct (maybe with a different parameter for which “merit” is a proxy), citations are a perfectly reasonable metric to use though one might want to smooth the metric, take logs, impose a maximum, etc when refining the analysis. The problems you cite with the metric aren’t likely to make much difference, especially if your own interpretation is correct, that it’s all driven by age or other innocuous factors orthogonal to “merit”.
What the Paik-Rivin paper describes as a “merit(ocracy)” stratification matches the robust “high and low against the middle” pattern seen in support for leftism, social justice, expensive government services, high taxes, wealth redistribution, communism, political correctness, antiracism, high immigration, and similar progressive projects.
Diversity, in this pattern, is supported by its direct beneficiaries (the “low”, e.g., letter signers from populations deemed diverse), and by the “high” ( very high performing mathematicians who will get jobs no matter the hiring system) who are not directly affected by diversity consideration but consume diversity as a luxury good. The cost of the luxury good is paid by the middle, the average but non-diverse mathematicians who may have to give up jobs, or reallocate their work time toward generating Diversity Statement credentials that might prevent the job loss.
This phenomenon goes by various names, e.g., Director’s Law in economics.
January 18, 2020 at 12:34 pm
STEM Caveman
p.s. if Lior deletes my long comment I’d be happy to repost it with the correct author names. Editing the name within the comment is obviously also fine if he has that ability. No point in accidentally naming someone uninvolved.
January 18, 2020 at 12:33 am
STEM Caveman
By the way, letter C looks like a very large fraction of the signatures were obtained due to a posting on a mailing list or website read by Soviet emigres. It reads like a Who’s Who of ex-USSR mathematicians, who of course are likely to be allergic to government-administrative bureaucrats running the faculty hiring.
January 18, 2020 at 4:26 am
Jake
Surely this has to be the same Joshua Paik who threatened to throw battery acid in a student’s face? https://www.dailyrecord.co.uk/news/scottish-news/st-andrews-university-student-suspended-11267218
January 18, 2020 at 5:14 am
STEM Caveman
I’m sorry for the possibly excessive number of posts, but I’ll add one more in the hope it keeps the subject of discussion from drifting to this nonsense.
It is obvious from the article that JP (and a diverse group of his friends) did not threaten anyone or anything, they exchanged snarky jokes on Facebook (“I’m a slut for murder”) fantasizing about murder and mayhem toward a student they disliked, egging each other on to more and more stupidity. The target wasn’t even aware of it until someone informed her. Police recognized it was unserious but the university found the joking itself sufficient to rusticate at least one member of the group.
January 18, 2020 at 7:11 am
Debbie
Great post Lior !
January 18, 2020 at 8:09 am
valuevar
Is the comments section here moderated at all? If so, I’m disappointed the comment above is mentioned at all. Let us try to avoid ad personam attacks, particularly against students.
January 19, 2020 at 12:52 am
Carina Curto
I completely agree. Josh is a 23-year-old student. He made a mistake, a big one on social media, when he was 20. He got expelled for a year. He’s been punished. He then came back and is now finishing his degree. I’ve actually gotten to know him recently, and from all my interactions with him, he’s not like that now. He’s a good kid, and very enthusiastic about math. People should be allowed to grow up and move on.
January 20, 2020 at 10:08 pm
STEM Caveman
From what was publicly reported, it’s entirely possible that JP and his friends did nothing at all wrong and are victims of a wrongful disciplinary action by the university. For instance, I would take that to be the case if the Facebook chat were private or not directly readable by the target of their talk.
It is also suspicious that the Daily Record, a Scottish tabloid, picked this up as a story. It looks like something “pushed” into the media by an interested party, with the tabloid being the only taker. The reporting is exaggerated and is not careful to distinguish between the de minimis stuff in a chat, and the much more serious idea of a planned or threatened “acid attack”. Again based solely on the public information, to me it look scandalous to have this person’s name tarred with anything that includes the words “acid attack” for what looks like a bunch of escalating jokes between friends. And if there is something unpublished that does justify the disciplinary actions, that does not mean that it includes anything that would justify those words.
Were I the blog owner I would delete everything to do with the co-author’s past history and limit discussion to the ostensible topic, statistics.
January 18, 2020 at 8:11 am
valuevar
Ah, well, it isn’t. Please edit my remark – I am not disappointed that the comment above is mentioned, but rather that it was made to begin with.
January 18, 2020 at 11:29 am
Joel Fish
Lior, I’m still rather curious about how the year 36 was chosen. I ask because, as I mentioned elsewhere, I get really different numbers when I change it a little to 38. Specifically:
The mean Google Scholar citations for professors less than 36 years since earning their PhD (i.e. PhD-age) appears to be:
Signers of A: 2922
Signers of B: 3148
Signers of C: 2358
The mean Google Scholar citations for professors less than 38 years since earning their PhD appears to be:
Signers of A: 2863
Signers of B: 3161
Signers of C: 4619
Just to be completely clear: The mean citations for Letter C effectively doubles when we replace 36 with 38, and the other two increase rather little. This would seem to rather strongly suggest that these age-restricted citation counts are very sensitive to choice near the number 36. I’m still wondering why and how this number was chosen.
January 18, 2020 at 11:31 am
Joel Fish
Curious, I dug into the data a bit, and here’s what I found.
The first thing I noticed was that this age cut-off is a very strange way to age restrict for comparison, since it means *none* of the citations of people Helmut Hofer’s age or more are counted…at all. Like, it would be one thing to say “well, let’s only count Noga Alon’s or Vladimir Rokhlin’s citations that occurred within (say) 36 years of earning a PhD, but that’s not what’s done here. What’s done seems to be just completely excluding all their citations because their PhD age is 37, and you chose 36 as the cut off year to compare signatories. Naively, it seemed to me that this could heavily bias the results. Would you agree?
On first pass, I also thought it might make some sense to age restrict to PhD-age less than 36 if actually none of the Letter A signers are “older” than 36 (or rather those who had Google Scholar citations), because one wants to make some sort of apples-to-apples comparison. But as pointed out in the blog post, there are indeed Letter A signatories who are more than 36 years out of their PhD; one is 36, one is 42; and one is 44. That means that the number 36 was chosen for some reason, and it does not seem to be chosen because it was the maximum age for Letter A signers.
If you or anyone else is curious about what happens at PhD-age 37, there is a massive spike in mean citation mostly due to the sudden inclusion of three people, who are contained in the top-five most citations of Letter C signers:
Nogal Alon (46,560 citations)
Vladimir Rokhlin (25,803 citations)
Janos Kollar (19,832 citations)
Because the mean citation count changes so drastically near this cut-off point, it seems important to understand how the number 36 was chosen for this analysis. For example, we should know that fine tuning parameter values to achieve a desired conclusion fits pretty squarely in the “questionable research practices” category — at best.
In any case, rather than fix a single year, I thought it might be a good idea to plot out this age-restricted mean-citation count as a function of PhD age. The big jump on Letter C signers at age 37 is pretty apparent. Also interesting is the single massive spike in mean citations for the Letter A signers that occurs at PhD age 21. It’s all due to one mathematician: Lior Pachter (67,694 citations… Damn that’s a lot!). This seems to suggest the “flip” between Letter A and Letter C signers “younger” than 36 is due completely to Lior.
January 18, 2020 at 1:51 pm
Lior Pachter
I chose age 36 because there were too few individuals among the Letter A signatories past that age (I’ve added the plot to the notebook for you). You can’t do a meaningful comparison between the Letter A and Letter C writers with two data points. The age distribution of the different groups restricting to age <36 is comparable to the extent where a direct comparison makes sense. Regarding my citations, it's true that I have many and that I raise the average of Letter A, however the same would be true for Letter C if someone with as many citations as me had signed letter C. But nobody among the dozens of individuals of similar age to me with a very large number of citations did sign Letter C. Having said that, I personally don't think citations are much of a proxy for anything, so I don't think there is much of a conclusion to be drawn one way or the other.
January 18, 2020 at 3:14 pm
STEM Caveman
If you read the list of signatories it is completely obvious that what Paik and Rivin wrote, comparing signature sets A-B-C to tiers of math departments, is correct. Roughly speaking, I immediately recognized some of the A’s, half the B’s, and all of the C’s.
That this strong and subjectively apparent pattern does not operationalize perfectly by literally counting citations is not a surprise. Considering how evident the pattern is, it seems pretty likely that it would be revealed more clearly and robustly if the citations were measured on a different scale (e.g. logarithmic, or classification into a few bins).
I don’t see the point of fighting so hard against the citation counts, or trying to prove that Paik & Rivin never heard of multivariate statistics when they are almost certainly right about the underlying “ground truth”. Clearly Rivin eyeballed lists A-B-C, noticed the obvious, and the paper was written later as an attempt to quantify what is visible.
The meaning of the A < B < C stratification is of course a different matter, and it doesn't matter much for the actual controversy about Mandatory Diversity Statements.
January 18, 2020 at 4:50 pm
Lior Pachter
What you wrote is false. Nowhere in the manuscript did Paik and Rivin perform a comparison of signatory lists according to tiers of math department. Also you can’t just wish a result to be true, and then pretend that it is after doing an analysis to answer a different question. That’s not how statistics works.
Paik and Rivin conclude that “it is then not surprising that people with
the most “merit” in the judgement of the community support the most meritocratic letters”… which is very much a statement about the individuals who signed the letters, not the tiers of the departments they work for.
January 18, 2020 at 6:19 pm
STEM Caveman
> “What you wrote is false.”
Please be more specific as to which words are false. Currently you are attacking a strawman: that saying Paik and Rivin “compared” sets A-B-C to tiers means they literally used Mean Institutional Rank, rather than citation counts, as the statistic in their paper. My actual assertion is that Rivin, as a longtime mathematician, looked at the lists A,B,C, came to exactly the conclusion that I did (and you might too) about the very different proportions of people on the three lists above any reasonable (non-extreme) level of current professional standing, career accomplishment, prizes, appointments or whatever operationalization you care to choose.
For whatever reasons, List C is considerably denser in this hypothetical, but nevertheless tangible, proxy for merit/achievement/status (call it what you will) than B, which is much denser than A. If you genuinely dispute this density assertion, rather than the details of one attempt to quantify it, or unrelated linguistic issues like the meaning of the English word “compare” or the legitimacy of the word “merit” as a 5-letter shorthand for “position in the academic-institutional hierarchy”, please make that clear.
January 18, 2020 at 10:22 pm
Lior Pachter
I’m curious how you think “operationally” about Rivin who was a signatory to Letter B? Do you think highly of him because his h-index is 24, or do you find that number mediocre considering other mathematicians with his pedigree (students of Thurston), even some who graduated much later, have a higher h-index? Do you discount Rivin’s mathematics accomplishments because Terence Tao, who is 15 years younger, has published 26 more papers than Rivin’s most cited paper… or are you impressed with Rivin’s number of published papers and total citations? Do you think Rivin has achieved a lot because he is a Fellow of the AMS? Or do you view his career as unproductive because he has supervised only 2 Ph.D. students? Do you think of him as a first-rate mathematician for having won the Whitehead Prize? Or is he a run-of-the-mill mathematician because he works at Temple University, a university that he describes as “mid-level” in his preprint?
Does he contribute to the density of your hypothetical proxies (call it what you want)? Or is he dilutive?
January 18, 2020 at 11:04 pm
STEM Caveman
The assertion is that if you take any objective indicator as a threshold (e.g., from your case study of Rivin — h-index at least 24, or is an AMS Fellow, or has a Whitehead-level Prize, or has graduated 2 or more PhD students) then the percentages of A,B,C above the threshold will be in the order A < B < C.
As stated above, of course you want indicators that are not so high (Fields medal) or low (has a PhD) that they include or exclude virtually the entire sample. Even at those extremes you may get the same pattern; list A has lots of junior people and I would not be surprised by some percentage of non-PhD's; and list C looks like there are at least 7 Fields medals, plus some winners of Abel or Wolf prize such as Gromov. This appeared to be considerably higher than the other lists though I did not check carefully.
Could you state clearly whether, after reading the names lists A-B-C, you think this testable prediction is NOT likely to be correct? Because, again, some form of that idea appears to be the gist of what you call Rivin and Paik's "main result". There is plenty of room to dispute the reasons why A < B < C but you are muddying the waters as long as you continue to argue this without commenting on whether that ordering (for a wide range of observables) is likely to actually be correct. It seems blatantly obviously correct to me, and apparently not only to me, when reading the lists.
January 18, 2020 at 11:29 pm
Lior Pachter
I have not read all the names on the lists (there are more than 1400).
January 19, 2020 at 12:05 am
STEM Caveman
Come now. There is no need to read anywhere close to 1400 names to test A < B < C for yourself. You could, for example, go to a random spot in the list and see how many of the first 50 names there you recognize. Or do a bit of inverse Poisson sampling (how many names need to be read to find the next recognizable one).
We are not talking about a minute difference in percentages where you have to count precisely to see they are different. The observation is that any relevant indicator will have *much lower* density on list A, than B, than C so you can *easily separate them* even when skimming. Certainly enough to satisfy yourself whether Rivin and Paik's main result, or its interpretation that I posted, are likely to be right.
Since you accuse Rivin and Paik, or me, of fantasizing these patterns ("you can't just wish a result to be true"), and at least for R&P have delivered a long lecture on their supposed incompetence, intellectual honesty would seem to require having a look into the minor detail of whether the "main result" is empirically correct. It is totally possible that their interpretation is wrong and yours (that it's age driven, or so age-confounded we can't tell) is right, but that is a separate question from whether they have correctly noticed the A < B < C pattern.
January 19, 2020 at 8:31 am
STEM Caveman
p.s. to avoid terminological quibbles: the standard term for the procedure I outlined (estimate average interval between hits) is “negative binomial” sampling, not Poisson or any sort of inverse or negative version thereof.
The point here is that the A-B-C pattern is clear enough you can see it very quickly by skimming the lists. It would take maybe 1 percent of the time spent on constructing this blog post, for someone with a math professor’s intuitive understanding of the math professional hierarchy and recognition of “math names”. Not doing such an easy exercise would indicate a strong desire to not learn the answer, so as not to have to admit the main empirical assertion (if not necessarily the conclusions) of the Paik-Rivin paper is correct.
January 18, 2020 at 11:47 am
valuevar
Hah, I was suspecting the same. Of course, once you leave mathematics strictly speaking, citation practices change greatly, and so comparisons of citation counts aren’t just to be taken with a grain of salt (or many) – they are worthless. Note we are speaking of Google Scholar counts here (unlike what is the case in Rivin-Paik), so applied fields face no disadvantage.
January 18, 2020 at 2:22 pm
Carina Curto
“I find the current debate in the mathematics community surrounding Prof. Thompson’s letter very frustrating.”
I also find the debate frustrating. One of the reasons is the way the signers of various letters have been caricatured. I’m happy to see Lior point out that the age effects are huge, and very difficult to correct for in this analysis. And I agree with him that characterizing Letter A signers as “second-rate mathematicians” is flawed.
But characterizing Letter B and Letter C signers as “anti-diversity mathematicians” (something implicit in this and many of the other commentaries I’ve seen) is also flawed. One can be strongly committed to increasing diversity the mathematics community, with a significant track record to prove it, and still have serious criticisms and concerns about mandatory (rubric-scored) diversity statements, as well as concerns about other top-down diversity initiatives.
There are many Letter B and C signers who care deeply about diversity in mathematics. The difference is not so much about values, but disagreements regarding the approach. As Lior says, “mathematicians need to think long and hard about how to change the culture in their departments.” Many Letter B/C signers want to do precisely this. But it requires some real discussion about the pros and cons of various university-mandated initiatives, including diversity statements, because these things can (and do) backfire.
January 18, 2020 at 2:29 pm
Lior Pachter
Thanks for your comment. I was very careful in my blog post to discuss the letters using quotes extracted from them. Unfortunately Paik and Rivin did not do that.
January 18, 2020 at 2:29 pm
k1monfared
Pairing this study with that of Topaz, the analysis shows the underrepresented groups of mathematicians get less citings than the ones in power. Then slogans of meritocracy are used to silence them. No surprises there.
January 18, 2020 at 5:19 pm
Falsehoods
You write “I had the second highest number of citations according to Google Scholar (67,694), second only to Terence Tao (71,530). We are in the 99.9th percentile. 👏 Moreover, I have 27 times more citations than Igor Rivin. According to Paik and Rivin this implies that I have 27 times more merit in the judgement of our peers”
You *do* *not* *have* 67,694 citations in *pure* *mathematics* (or even *mathematics* pure or applied). You have about a dozen citations in pure math (only three papers!) and by the most generous (mathscinet) count you have 400 citations in applied and pure math. Journals that are not indexed by mathscinet do not qualify as a math journals, and publications in them *do* *not* qualify as publications in mathematics.
But it’s amusing to see that you think that because of bio citations you are comparable to Terence Tao.
Furthermore even if we disregarded the above, your “second only to Terence Tao” sentence is provably incorrect. Witten has much more of a claim to being a mathematician than you and Witten has 199318 citations on Google Scholar.
Will you amend the falsehoods that you wrote?
Notice that once we correct your falsehoods, the claims of Paik and Rivin as applied to you, stand scrutiny.
January 18, 2020 at 5:43 pm
Lior Pachter
I don’t think for a second, or even for a femtosecond, that I’m a mathematician of the caliber of Terence Tao. But Paik and Rivin do, because they would judge my “merits” relative to his according to our number of citations scraped off a website. That’s exactly what they did in their preprint.
In regards to what papers constitute “real math”… good luck with that. And as for journals, there’s plenty of great mathematics published outside what MathSciNet indexes.
January 18, 2020 at 7:19 pm
Audrey Fu
You wrote ‘Witten has much more of a claim to being a mathematician than you’. But Witten didn’t sign any of those letters, in case you haven’t noticed.
You also wrote ‘because of bio citations you are comparable to Terence Tao’. Why not? There is no doubt that Dr. Pachter and many other statisticians/mathematicians working in similar fields have many, many more insights on biological data than Dr. Tao does, and these insights have greatly helped advance science. Or do you mean that only pure mathematicians are *real* mathematicians? By your standard, even Dr. R. A. Fisher, the founder of modern statistics, who also published most of his papers in *bio* journals (https://en.wikipedia.org/wiki/Ronald_Fisher_bibliography), is no good to you, is he? And this is precisely the pre-50s attitude toward statistics mentioned at the beginning of this blog post.
January 19, 2020 at 2:12 am
valuevar
As you and I know, Fisher published plenty in a journal called Annals of Eugenics, so I really wonder what has to count as a mathematics journal if catching Fisher’s output is the criterion. (Actually, thinking of it, a basic (meaning “very useful”) result in combinatorics is in one of those papers; not something one adds to the bibliography without second thoughts!) Note that “not mathematics” equalling “no good” is something that is clearly implicit in your post, not in the one being replied to. Obviously papers published in non-math journals can be full of insights on biological data, or on life, literature, etc., and of course help advance science. It’s strange to support Fisher (as if he needed it) by insisting on counting him as a mathematician; we don’t try to support Gauss by counting him as a statistician, or an actuary (though statisticians may count him as one of their own; I recently learned that actuaries actually do count him as one of their culture heroes, with some justification).
January 19, 2020 at 1:50 am
valuevar
The blog post does a good job of pointing out some weaknesses in the paper. Then it closes off with a bit of analysis that is even weaker, not to say cooked-up. (“Questionable research practices” would be putting it mildly, if it were meant with a straight face.) It is really a case of motte-and-bailey: under pressure, it will be portrayed as a jocular flourish, or a demonstration of how you can get anything if you make arbitrary choices in your data analysis; in the meantime, or to a broader public, it can come across as actually showing something. (Cf. “the perfect human is Puerto Rican” https://blogs.scientificamerican.com/voices/there-is-no-perfect-human-in-puerto-rico-or-anywhere-else/ , though of course making fun of James Watson is a noble cause.) The same goes with the comparison with Tao, and other mathematicians, by means of citation data; under pressure, it is portrayed as a reductio ad absurdum, but it is already being defended as a follower with a straight face.
January 19, 2020 at 2:01 am
valuevar
*by* a follower. An “edit” button is missed.
January 19, 2020 at 1:56 am
valuevar
On the wider issue of using citation counts to compare mathematicians, or groups of mathematicians: it’s evidently a very silly measure by which to judge a mathematician, or compare two professionals, as there are much better ways available. When used to compare two groups of professionals, however, it may have *some* value; it certainly tells us something (just like, say, impact factors for journals do), though we may argue about what that something is. It would be difficult to come up with a substitute that is not controversial. Very many of the signatories of the letters (particularly: of letter A) are not and never were active research mathematicians, and neither are they supposed to be, as they teach, for the most part, in non-research-oriented colleges. Paik and Rivin do control for that variable, but one can wonder why (and then get angry replies).
January 19, 2020 at 2:01 am
valuevar
As for judging arguments by their worth, rather than by whom is making them: of course *I* am in favor. It’s unclear to me that Pachter or Rivin are in favor – or that they aren’t, even if Pachter claims that Rivin isn’t. The Rivin-Paik paper was clearly meant in reply to the piece by Chad Topaz et al., which analysed the signatories of the letters by national origin and ethnicity (yes, assigning ethnicities to individuals and compiling lists; how is that not tremendously questionable?).
January 19, 2020 at 2:16 am
valuevar
(Of course what Rivin-Paik and Topaz’s statistics may reflect is simply that the letters were circulated in different professional networks, some correlating strongly with mathematical level, and some correlating strongly with national origin or even ethnicity, however defined.)
January 19, 2020 at 2:18 am
Lior Pachter
It’s Paik-Rivin.
January 19, 2020 at 2:27 am
valuevar
Thank you.
January 19, 2020 at 3:29 am
Paul Goldberg
Thanks for the interesting article. This misinterpretation of the data also speaks to the way the mean is distorted by outliers (here, a few people with very high citation counts), and in practice it’s the median that we should care about.
January 19, 2020 at 9:49 am
Lior Pachter
It’s true that the median is robust to outliers, and is better to use in cases where some measurements may be excessively noisy. I was thoughtful about working with the mean in this blog post, because in this case there are several reasons why one might weight high-citation individuals *more*. For one thing, by Paik-Rivin reasoning such individuals have more merit, hence their signature should count more. That argument aside, it stands to reason that high-citation individuals have more coauthors and collaborate more extensively (just a hypothesis; I haven’t actually checked this), and if so may have a different perspective on administrative matters, discrimination, etc. in academia.
January 20, 2020 at 1:54 am
STEM Caveman
1. I’ve read the paper more carefully now, and there is no “misrepresentation of the data” there. You really should look at it directly rather than take this blog post as gospel, especially if you have some understanding of the math profession in addition to the statistics.
2. The paper gives both the median and the mean for all the statistics where both are of interest.
In particular, for citation count, the ratio of mean to median is close to 1.5 for all three letters (A 1.46 , B 1.6, C 1.6). For the other statistics the ratio of mean to median was not too different (within a modest factor, like 2, for any pair) for all three data sets, so it’s not clear if it would have made any difference to the analysis to use medians everywhere. Personally I would not take averages of a probably heavy-tailed quantity like citation counts without doing some sort of rescaling or other adjustment, but the reasoning in the paper isn’t particularly dependent on the citation counts. They are used as one of some 10-20 similar metrics that all tell the same story.
For a host of measures provided in the paper, including both the mean and median versions wherever relevant, the list of signers of letter C dominates B which dominates A. This is part of the evidence that A < B < C is a robust pattern, which is not too surprising if you (have some knowledge of the profession and) actually *read the lists* and judge them informally.
For all the implications of "misrepresentation", if you look through the blogpost and comments you will notice that this aspect of the paper is nowhere mentioned or addressed, let alone refuted, and that Lior is refusing to clarify his stance on it in response to my questions.
My opinion having looked at the paper more carefully, and done some tests using other data not in the paper, is that this blog post is a hit piece on Igor Rivin, "by any means necessary". Whatever you think of the theory the paper proposes in the final section, the A < B < C analysis seems correct and robust and the qualitative comparison to "tiers" of institutions is a reasonable way to think about it.
January 19, 2020 at 11:09 am
ConfusedObserver36
Two comments:
1) Why so much arguing about who signed which letter? Wouldn’t it be more productive to discuss the actual issues, e.g. how best to support diversity?
2) Even if you can statistically say something about who signed which letter, this is hardly the result of a representative survey. Many people in the community were not aware that these letters were available to be signed, and people who did know about the letters passed them around to their friends. So it is not surprising that the signers of any given letter are a skewed sample of the whole community, and it could be for this reason alone rather than any political reason.
January 19, 2020 at 2:15 pm
ConfusedObserver37
1). Just because y is more productive than x doesn’t mean x shouldn’t be done. I’m sure going to Africa to feed the homeless would be more productive than discussing “issues” of diversity in math.
January 19, 2020 at 5:02 pm
Ranjeet Tate
And isn’t mathematical literacy important for all statisticians?
January 19, 2020 at 5:09 pm
Lior Pachter
Of course. And statistics Ph.D. students do study mathematics and certainly are literate in math. First, many (most?) have an undergraduate degree in mathematics, and then they must take math courses as Ph.D. students. E.g. at UC Berkeley, students are expected to know at least some measure theory and functional analysis just as a baseline before doing more math. See
https://statistics.berkeley.edu/programs/graduate/phd
January 20, 2020 at 4:47 am
STEM Caveman
I want to post a few calculations quantitatively addressing (i.e., refuting), the main assertion in this blogpost, in the boldfaced paragraph that purports to destroy the Paik-Rivin paper.
> “The main conclusion of Paik and Rivin, that signers of letters A have less merit than signers of letter B, who in turn have less merit than signers of letter C can be seen to be complete rubbish.”
The statement “A < B ” What the data reveal is simply that the signers of letter A are younger than the signers of the other two letters.”
It is unlikely that age alone can account for the empirical differences. Here are the calculations for two observables, Fields Medals and AMS Fellows.
The signers of A are 12-14 years younger compared to group C, in mean and median. Group C has slightly over 5 percent Fields Medalists (7 of 134). There are over 600 signers of A-only, none of them with a Fields medal. Age cannot explain the difference because even if all the Fields medals in the next 16 years (4 x 4-or-fewer medals) were given to members of A, that is far short of the 30 needed to reach 5 percent of the people in A. You can repeat this analysis with confidence intervals for the “true” rate of Fields medal-earning in the two groups and it makes no difference, there is no way A can catch up to C based on age alone.
The same analysis applies to AMS fellows. List C is more than 75% AMS Fellows. In order for list A, which has very few (9 of 616) AMS Fellows to catch up in the next 15 years, with about 60 AMS Fellows awarded per year, would require 400 of the next 900 Fellows to be people on list A. In other words, 44% of imminent AMS Fellows have signed list A, although 600 people is only a small percentage of mathematicians as a whole. So for some strange reason, future AMS fellows would have to be, let’s say, 10 or 20 times more likely to sign letter A than the average mathematician even though the current AMS Fellows are 10 times likelier to prefer C than A. That is, a 2-orders of magnitude change in relative preference for A compared to C would have to take place in about one academic generation, 15 years. That’s completely unbelievable.
January 20, 2020 at 4:53 am
STEM Caveman
(The response to the first of the two boldface sentences was cut off by WordPress, here is an attempt to repost. Answer to the second sentence was posted OK.)
> “The main conclusion of Paik and Rivin, that signers of letters A have less merit than signers of letter B, who in turn have less merit than signers of letter C can be seen to be complete rubbish.”
The statement “A < B < C on any relevant well-defined metric" appears to be correct and robust, as discussed at length (and nowhere specifically contradicted) in earlier comments.
Also, Paik and Rivin don't take any position on whether their metrics reflect merit in any normative or moral sense (e.g., that higher merit indicators mean a better person or deserving of higher pay).
January 20, 2020 at 5:09 am
STEM Caveman
correction/improvement of the calculation for AMS Fellows: about 50% (450 of 900), not 44%, of the next 15 year’s AMS Fellows would have to be awarded to signers of letter A, in order for A catch up to C in the next 15 years. The 450 is the group C rate, 75% AMS Fellows, applied to a population of 600. The actual size of population is 616 with 9 AMS Fellows, so we would need 453 of 900, so essentially half.
January 20, 2020 at 1:27 pm
Anon 2020
This discussion reminds me why I don’t socialize with my colleagues (mathematicians). In my department this same fallacy repeats itself over and over again: it is assumed the best mathematicians are also the wisest people. Weight should be given to arguments, not the people who make them. Maybe spending less lunch time conversations sorting people, and more time… doing almost anything else.
January 20, 2020 at 2:53 pm
STEM Caveman
We really need a term in online discussions for “asserting a fallacy with no evidence that it was actually committed”. The only cases I see here of anyone bowing to the wisdom of stronger mathematicians are of people taking Lior’s word for it that this blog post has destroyed the Paik-Rivin paper. Since you’re replying to my comment, I’ll point out that I wrote a few comments ago that the sorting and ordering are irrelevant to the underlying political issue of Mandatory Diversity Statements.
I happen to think (and have argued in various forums) that Fields medals should be abolished. Like all prizes for brilliance rather than accomplishment alone, they undermine the, uh, field.
But if Fields medals as statistical data refute Lior’s claim that age explains the pattern that Paik and Rivin (correctly) identified, then I will happily calculate numbers of Fields medals, regardless of my personal opinions.
And the same for citations, AMS Fellowships and other metrics.
There is also something that is both a statistical fallacy and a dishonest rhetorical move being pulled by opponents of the Rivin-Paik paper. The trick is to argue against the ridiculous idea, that probably nobody in the discussion has ever entertain, that citation counts are a valid linear ordering of individual merit/ability/achievement, as though the ridiculous idea can be inferred from the reasonable and correct analogous idea about comparison of large populations that have large differences in their citation numbers.
January 20, 2020 at 4:53 pm
Lior Pachter
It’s the Paik-Rivin paper. Not Rivin-Paik.
Regarding citations, they literally describe citation counts as a a proxy for merit in the judgement of the community.
But beyond that, using citations even averaged over individuals or papers, is a terrible idea. Consider that the h-index of the most cited *journal* in mathematics is not even in the top 20 of biotechnology journal list (https://scholar.google.com/citations?view_op=top_venues&hl=en&vq=bio_biotechnology vs. https://scholar.google.com/citations?view_op=top_venues&hl=en&vq=phy_pureappliedmathematics). Even within mathematics, there are widely variable citation numbers depending on area (e.g. logic vs. mathematical physics vs. discrete math). The size of the area, i.e. the number of people working in it, really matters, as do citing conventions within the field. Do we discount number theory as a field because it generates fewer citations than combinatorics? Andrew Wiles, for example, has many fewer citations than some combinatorialists. So what? The difference very much reflects different research modalities in the two fields.
As I said in my post, using citations as proxies for merit is a fool’s errand.
January 20, 2020 at 6:30 pm
STEM Caveman
> Paik-Rivin paper. Not Rivin-Paik.
1. Rivin is presumably responsible for virtually everything you criticize about the paper (e.g. any non-numerical comments on things like tiers, Russians, and shirts).
2. Rivin is also, presumably (I presume it and assert it, in any case), the reason for this blog post and for pursuing things as aggressively as to call the authors in need of a basic statistics class. Igor has crossed swords with you in earlier long comment sections on this blog, is a sort of bete noir here and on Woke Math social media generally, and is presumably the reason you made this blog post. I don’t imagine a, ahem, *60K citation* professor with 3 kids and a rocking career, would spend a lot of time constructing blog posts, graphs and charts calling attention to an otherwise unheard of paper (co) authored by an undergraduate, a paper that has probably had its readership Streisand Effect-ed by a factor of 100 from being linked here, if not for the personal or political motivation to take down the Bete.
3. There are people who, on principle, randomize the order of authors when referring to math papers (to counteract “alphabetic privilege”, to coin a term). Surely you can endorse that! And if not, as a matter of honesty in this discussion, let us give Rivin his due in some fraction of the reference. I can’t fathom what on earth you think is wrong and in need of correction when I and one or two other posters write it in the alternative order from time to time.
> “widely variable citation numbers depending on area”
In the case of letters A-B-C, we not only have large differences between large populations, but there is no reason to believe that membership in the three groups correlates strongly with within-area citation rates. After all, you are an outlier, from a field with high citation velocity, but you signed A. The ivory tower, glasperlenspiel type of fields like number theory are *over* represented in awards (think how many arithmetic geometers and Landlands programmers got the Fields medal) that seem to be landing disproportionately on the B and C people. To the extent that there is a problem I see no indication that it’s large or going in the direction that helps the Paik-Rivin (or Rivin-Paik) theory.
By the way, I did a rough count and Putnam competition winners also show the C > B >> A ordering, with A being much weaker as on other metrics. But there is no age effect on Putnam status, so like the Fields medal and AMS Fellows, it is a further indication that your age theory doesn’t explain the data, and Paik and Rivin could surely nail this down much better by scraping the IMO medal database (imo-official.org) and linking it with theirs.
January 20, 2020 at 10:53 pm
Lior Pachter
I think it’s time for you to come to terms with the fact that despite your manifold torture of the data, it has not confessed.
January 20, 2020 at 11:53 pm
STEM Caveman
I’m curious. There are a lot of International Math Olympiad gold/silver medalists on lists A-B-C, and the time effects that affect citation counting (overweighting longer careers) don’t apply to that metric. Counting IMO medalists actually underweights older people, since the number of IMO participants and especially the number who end up in US math academia, has grown over time. So this is a comparison that is if anything stacked against the C > B > A pattern —- if the pattern is age driven as you claim.
Now, if Paik and Rivin (or I) were to count IMO medalists and show that the C > B > A pattern is obeyed yet again, as it appears to be for every threshold observable, would you take that as evidence against your “age explains it” thesis? For that matter, what do you make of the AMS Fellows calculation, where in order to *not* have C beating A, half the new Fellows in the next 15 years would have to be on list A, and 3/4 of the signers of A (many at teaching institutions) would have to somehow become Fellows?
January 21, 2020 at 12:11 am
Lior Pachter
Regarding the IMO… I very much like these words of wisdom by Bill Thurston:
“There are also state, national and international competitions. These competitions are fun, interesting, and educationally effective for the people who are successful in them. But they also have a downside. The competitions reinforce the notion that either you ‘have good math genes’, or you do not. They put an emphasis on being quick, at the expense of being deep and thoughtful. They emphasize questions which are puzzles with some hidden trick, rather than more realistic problems where a systematic and persistent approach is important. This discourages many people who are not as quick or as practiced, but might be good at working through problems when they have the time to think through them. Some of the best performers on the contests do become good mathematicians, but there are also many top mathematicians who were not so good on contest math.”
January 21, 2020 at 1:45 am
STEM Caveman
Well, of course if the data says that C > B >> A on a variety of measures, and seemingly on all threshold measures (percentage of list having some credential), one can just dismiss all the measures as imperfect and limited.
But your thesis was that all these imperfect and limited C-B-A patterns, *regardless of the imperfections and limitations* of the metrics used to construct them, are just statistical artifacts that come from the higher ranked populations being older. If the IMO and the Putnam contest are similar measures with similar imperfections and limitations, as Thurston and a thousand others have noted, but are not subject to any age or time related artifacts, and still display the C > B >> A pattern, isn’t that precisely the sort of evidence needed to reject your “age explains it (regardless of other problems)” theory?
Also, the Fields medals and AMS Fellow awards are relatively free of these limitations, are they not? i.e., they represent some sort of legitimate professional achievement rather than pavlovian puzzle races (that of course have nothing at all to do with real mathematics except insofar as 3/4 of the younger Fields medalists were champions at the silly pavlovian exercise, and IMO medalists publishing quite a lot more papers than non-IMO-medalists, leading to higher citation counts and more AMS Fellows awards and employment at higher tier institutions, which of course are also silly and meaningless distinctions that only an elitist bete noir might take seriously.) If we can show by simple calculations that when the younger populations reach the present age of the older ones (wait 16 years) they cannot possibly catch up on Fields medals and AMS Fellows, isn’t that also exactly the type of information that contradicts the “age explains it, therefore Paik and Rivin are morons” theory?
January 21, 2020 at 3:26 pm
Shifting waters
So Lior after the flaws in your reasoning have been eloquently pointed out by STEM Caveman your position appears to now have shifted to “nothing is an indicator of mathematical excellence so the paper of Paik-Rivin is bogus”.
It’s patently clear to the naked eye that the people that signed letter B and C are (in the majority) far more accomplished in all metrics other than wokeness and community building than the signatories of letter A. To begin with it will hard for you to find an actual mathematician who thinks otherwise, but please, indulge us!
Either way, it’s amusing to see a distinguished Bren Professor put himself in the loosing position of wanting to disprove the methodology of a paper rather than the claim, to then declare that ipso facto the claim is also bogus. It is hard to believe that you yourself believe the claim to be incorrect (that signatories of the letter B and C are in the majority far more distinguished).
That being said, the futility of the Paik-Rivin paper given the obviousness of the claim (that signatories of the letter B and C are in the majority far more distinguished) is a topic for another time… My suspicion is that it was a trap for you and the other wookies and you fell right into it.
January 21, 2020 at 7:06 pm
STEM Caveman
> “distinguished … Professor … disprove the methodology of a paper rather than the claim, to then declare that ipso facto the claim is also bogus.”
Noam Chomsky made a career out of that! The additional twist that he pretty much patented, and Lior does not do, is to cleverly choose the words so that on any plain reading they appear to be directly disputing the factual claim, but have a byzantine double-backflip alternative parsing in which they are merely commenting on “meta” issues about the sources and reporters and incentives and information delivery systems and everything other than the actual information and whether it is correct.
January 22, 2020 at 9:09 am
Igor Rivin (@igriv)
First, we (Josh Paik and I) would like to thank Lior Pachter for bringing this up for discussion, and of the commenters for their insightful comments. We have considered the objections, and addressed them here: https://joshp112358.github.io/Response-to-Pachter/ (a version will migrate to arxiv.org in due time).
January 22, 2020 at 1:20 pm
STEM Caveman
Nice. I have some suggestions for improving the analysis and presentation.
1. Provide a graph like the ones in the section on hypertuning, showing the relative position of A-B-C when citations are penalized by (age)^p for a range of values of p.
2. Mention that restricting to full professors or R1 universities or people N years past the PhD, makes the actually compared subsets of A-B-C more similar to each other than the unrestricted lists, because the restriction criteria positively correlate with citations. This does not apply to the age-penalized citation counts for penalties large enough to kill or reverse the correlation.
3. Math competition awards (i.e. percent on each list having the award) are a comparison controlled for age, in the strongest possible sense since 99 to 100 percent of the individuals on the lists are no longer able to earn more such prizes. Imo-official.org and Wikipedia’s Putnam contest page have lists of names in ready-to-roll spreadsheet format that can be easily copied into your database for automated processing. Since these data also appear to show the same C > B > A pattern, are if anything biased toward the opinions of younger people as a sample (for reasons explained in an earlier comment), and link up with your arguments about “meritocracy” at the end, I’d add them.
4. Consider adding the “threshold” formulation of C > B > A as in the comments here. It is a standard concept of dominance of distributions and is not tied to particular debatable metrics like citation count, but tries to capture directly what it means for one group to be stronger than the other. I think it is most commonly referred to as “stochastic dominance”.
5. For the hypertuning analysis, I and probably everyone else immedately wondered, when seeing Lior’s graphs, how sensitive they are to the specific number 36, and I wanted to see the results for all other choices of the cutoff. You have done that and shown that 36 is optimal, maybe optimized, for getting Lior’s result and I’d be astonished if he hadn’t tried other values.
However, for a *fraud* analysis, although Lior was aware of being an outlier and used that as an argument against citation counts, I don’t think he was required to investigate the effect of removing himself from the data set, for purposes of that section of his post. He should have considered somewhere the more general possibility that, as the one huge citation outlier in list A, he was personally responsible for making A rank higher than in reality, but an unbiased correction would have been to remove everyone with more than X citations from all lists or to do one of the rescalings of citation count that I suggested. So “fraud” is too strong.
What your hypertuning analysis shows is how strong the C > B > A pattern (or the “A is much weaker” pattern if you want to be conservative) is; the only way to get a different result is to not only use a very particular parameter, but even then it is all dependent on having one extreme outlier, from essentially a different field (citationwise), propping up the metric for A.
January 22, 2020 at 2:41 pm
STEM Caveman
6. The second graph in the hypertuning section, with Pachter removed from list A, should also be done in at least one version version where all three lists have their top outlier (or more) removed.
7. If you do include age controls via IMO data, then the physics and computer olympiads also have databases online using the same software. I would expect some intersection with lists A-B-C and an improvement in accuracy from combining all of the awards together.
January 23, 2020 at 3:16 pm
STEM Caveman
Two more.
9. The section on AMS Fellows would be a lot clearer if you displayed percentage of Fellows, not only the total number, on each list.
10. Calculate statistics for group D = signers of both B and C, and for groups E, F = signers of only-B and only-C. Although one would think D is some blend of B and C, it also represents the strongest level of opposition to Mandatory Diversity and wokeness. If D turns out to rank higher than C, then D “explains” some of the high metrics of A (it is about 1/8 of A but half of C, so an imported elite so to speak). If things look like A < B < E < C < F < D , even if it lowers the statistical significance of some comparisons in the chain by reducing the group sizes, that would be striking and in the direction of some of your conclusions. Currently there is some blurring of the groups due to comparing B and C rather than B-only, C-only, and B-and-C.
January 23, 2020 at 3:35 pm
STEM Caveman
that’s A-E-B-F-C-D, and D explaining B.
January 22, 2020 at 3:48 pm
Rogi Nivir
@Igor, should you be posting a response to arXiv? Seems a bit inappropriate for arXiv. ArXiv is not for debates.
January 22, 2020 at 5:13 pm
Igor Rivin
Arxiv is not for debates, but it is completely appropriate for clarifications and fixing whatever needs fixing. The paper can be improved, so we are improving it.
January 22, 2020 at 5:49 pm
STEM Caveman
The way of Woke is to challenge others’ right to speak, and if they do have the right (in this specific case, “right of reply”), control where and how the speech is allowed to take place.
Arxiv title search “reply to” : 1012 results
https://arxiv.org/search/?query=%22reply+to%22&searchtype=title&abstracts=show&order=-announced_date_first&size=50
With that said, updating the paper at arxiv (and this blogpost) would be more readable than a chain of multiple documents.
January 22, 2020 at 5:54 pm
Igor Rivin
@STEMCaveman Absolutely, this is the plan.
January 23, 2020 at 12:27 am
STEM Caveman
@Igor, will look forward to seeing the next version. The woke politics continues to be insane. On Twitter, Gowers immediately took Lior’s post to be completely convincing that it’s all due to age, which shows that expertise is, uh, “specialized” — but it still had the effect of amplifying the outrage mob.
I do think there is both a meritocracy effect and an emigration-from-Communism effect, as well as the high+low vs middle pattern described above; but that they are hard to disentangle from the sampling. I would guess that more signers of A found it through “low” sources like social media, C was more through “high” mailing lists and professional networks (hence the high concentration of Russian emigres), and B intermediate.
Thinking about what would be the equivalent of “remove top outlier in A” from B and C, it seems to be “remove the top X percentiles from those lists, where X% = 1/(size of A)”. Because of the different sizes of list, that means not entirely removing (replacing a unit mass by zero) some of those upper individuals, but replacing their unit mass with a lower fractional mass so that each list has the same fraction of its mass removed at the top.
January 24, 2020 at 3:36 am
Rogi Nivir
Ah, I thought you would be posting a new paper rather than updating. Makes more sense.
January 22, 2020 at 4:40 pm
valuevar
An eighth suggestion: leave the second half of “discussion and conclusion” out. As it delves into matters of politics (or political principle), the impact of the rest of the paper (which deals with facts) is made weaker. Readers are not idiots, and can draw their own conclusions.
January 22, 2020 at 4:41 pm
valuevar
Pachter also does as much, but why follow a poor example?
January 22, 2020 at 4:41 pm
valuevar
… not to mention that Pachter does not have a junior coauthor to think about.
January 23, 2020 at 9:13 am
Sebastian
Bernd Sturmfels:
https://www.europeanwomeninmaths.org/nlalg-mpi-mis/
January 23, 2020 at 12:13 pm
Sebastian
https://www.hepg.org/blog/seizing-the-moment-possibilities-for-equity-and-j
January 24, 2020 at 4:14 am
STEM Caveman
> There are numerous other technical problems with the preprint.
Before we get to those, let’s just note that there’s a majorly major non-technical problem with your criticism. You (Lior) say that you read list A and were pleased by what you found, so apparently it’s not that onerous to skim 600 names. But you refuse to comment on whether you have perused B and C or are willing to do so; and if you did peruse them, how did they compare, intuitively, to A. Once there is a clear answer to that, the charade is over.
Paik and Rivin directly addressed the substance of your criticisms, and very quickly, with a rebuttal. In contrast you are oddly silent, trying to keep up the fiction that they are totally wrong and your blog post demolished their paper. Even the Chad Topaz QSIDE report provides data for the A-B-C stratification! The percent employed at research institutions looks just like what I posted here about the proportion of recognizable names on the lists.
It’s like those MeToo cases you prosecute here. In the long term, fess up is better than cover up. Or so they say.
> The authors claim to have performed “a control” (they didn’t).
They used Rutgers faculty as a control group. i.e., they computed the same metrics for the list of professors at Rutgers math department as for the groups A, B, C being examined. How is that a technical problem? Maybe “benchmark” or “comparison” would be clearer, but there is nothing logically wrong with calling it a “control”, and nothing in their paper depends on what they call it.
> Several p-values are computed and reported without any multiple testing correction.
This is a bogus criticism. You appear to be saying that in several sections of the papers they test hypotheses that are not independent, e.g. A < B, B < C, and A Parametric approximations for the citation data are examined, but then ignored.
This does not create any technical errors, and they did not ignore it in the rebuttal. Does the age^1.3 handicap for citation growth adequately falsify your explanation in terms of age, or not? And if you do insist on absolute deterministic control over age rather than parametric corrections, there are IMO and Putnam numbers and the calculations above for Fields Medals and AMS Fellows. As imperfect and limited as all those are, they are meaningful and correlate well with every other indicator, but with the age issue removed.
> Moreover, appropriate zero-inflated count distributions for such data are never considered (see e.g. Yong-Gil et al. 2007).
Given the above this could certainly use some elaboration.
January 24, 2020 at 4:21 am
STEM Caveman
(WordPress cut some text again. Reposted here.)
> Several p-values are computed and reported without any multiple testing correction.
This is a bogus criticism. You appear to be saying that in several sections of the papers they test hypotheses that are not independent, e.g. A < B, B < C, and A Parametric approximations for the citation data are examined, but then ignored.
This does not create any technical errors, and they did not ignore it in the rebuttal. [Continuation posted in preceding comment, re: age^1.3, etc]
January 24, 2020 at 4:29 am
STEM Caveman
(2nd attempt to repost missing text. 1st is deletable as it didn’t work. I have removed angle brackets in case that is what bothers WordPress.)
“Several p-values are computed and reported without any multiple testing correction.”
This is a bogus criticism. You appear to be saying that in several sections of the papers they test hypotheses that are not independent, e.g. A vs B, B vs C, and A vs C, so the p-values should be tripled. But B and C so totally dominate A that it doesn’t matter what one does to those p-values, and when comparing B to C they stacked the deck very heavily in favor of the null hypothesis by counting more than half of group C (the ones who also signed B) as members of group B. Had they used disjoint groups B-only, C-only and B-and-C, the comparisons would be sharper and the p-values qualitatively lower. So in effect they super-hyper-corrected the p-values already by mixing the samples.
“Parametric approximations for the citation data are examined, but then ignored.”
This does not create any technical errors, and they did not ignore it in the rebuttal. [Rest of paragraph was posted OK in parent comment.]
January 24, 2020 at 6:46 am
Sebastian
If the UK didn’t have a strong, diversity-oriented refugee program…
https://www.theguardian.com/science/2018/aug/01/former-refugee-among-winners-of-fields-medal-the-nobel-prize-for-maths
January 24, 2020 at 8:13 am
Sebastian
“…AI’s first priority should be to help promote our fundamental human rights, enhance social relations and reinforce solidarity. Diversity should also figure within these priorities.”
View at Medium.com
February 6, 2020 at 3:12 pm
Joshua Paik
Version 2 is on arxiv
June 6, 2020 at 6:28 pm
Martin
There is quite a lot of research suggesting that
a) women tend to have different and wider interests, i.e. if they are interested in maths, they tend to have other interest as well,
b) at the very top of the IQ distribution, men outnumber women at least 3:1 (this should give pause to anyone demanding sex parity in cognitively highly demanding fields).
And then there is the simple fact that different populations tend to have different IQ scores, with East Asians at the top and Blacks at the bottom. Most IQ researchers tend to think that intelligence, of which IQ is a proxy is to a significant degree influenced by genes. I suspect that Professor Pachter and many of his readers will reject this (the genetic basis of intelligence and the limits of boosting by educational intervention) as mere speculation but the fact that there is a gap is an undeniable fact.
Now even if we assume that the IQ gap is entirely due to environmental differences, it seems unlikely, even for the most ardent environmentalist, that these differences can be eliminated once students enter college. If one subscribes to this pure environmentalism then one ought to focus on earlier stages in education. Once college starts the die are cast.
This then should give pause to anyone demanding more diversity. The prime criterion should be ability and merit. Other factors, if they come into play must always undermine these two criteria as there are never two applicants of exactly the same merit and ability that just differ by socio-economical or ethnical background. Diversity must necessarily be opposed to meritocracy.
June 9, 2020 at 8:54 pm
Nitram
Martin,
One standard response (I think) would be that increasing diversity in the higher up stages of academia would influence those in the lower stages to join (e.g. women in middle school seeing many women math professors would increase the chance they study math), thereby indeed positively affecting “earlier stages in education”.